Chart Result Viewer Guide
Overview
The Chart Result Viewer is used to view existing chart results.
Opening the Tool
You can access the Chart Result Viewer in several ways. Tools can be opened from the signOn page, the home page, and from various tools using the hamburger  menu.
menu.
From the Home tool.
Alternatively you can open the tool from the hamburger menu on each tool.

. . .

Pressing the control key during the menu click opens the tool in another tab.
Layout
The main portions of the toolbar and layout of the window areas are depicted below.
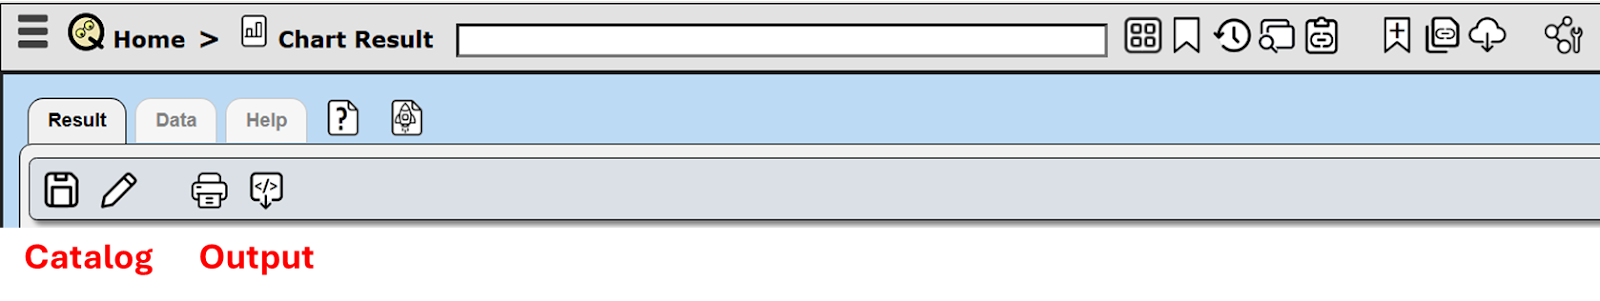
The toolbar sections are
- Catalog interactions and
- Output options.
Catalog Options
The searching for text does span pages in the forward direction.
| Icon | Description |
|---|---|
 | Save the chart. This is only really relevant if you change the chart’s properties. |
 | Edit the chart properties. This can be used to edit the chart’s free form description. |
Output Options
The searching for text does span pages in the forward direction.
| Icon | Description |
|---|---|
 | Print the chart. |
 | Export the chart content. The default format has the labels and then an array containing each data series. Using control-click formats the data as a list of rows with each row containing a label and a value from each data series. |
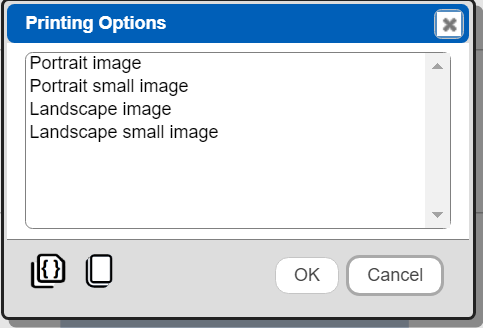
Printing
The print options dialog is shown below.
Exporting Content
The export dialog is shown below.

Below is sample output using the default options.
[
  {
    "labels": [
      "mouser",
      "meower",
      "kitty",
      "kittycat"
    ],
    "dataSeries": [
      {
        "name": "Ages",
        "data": [
          4,
          6,
          6,
          6
        ]
      }
    ]
  }
]
Below is sample output using the control-click interaction.
[
  {
    "name": "mouser",
    "ages": 4
  },
  {
    "name": "meower",
    "ages": 6
  },
  {
    "name": "kitty",
    "ages": 6
  },
  {
    "name": "kittycat",
    "ages": 6
  }
]
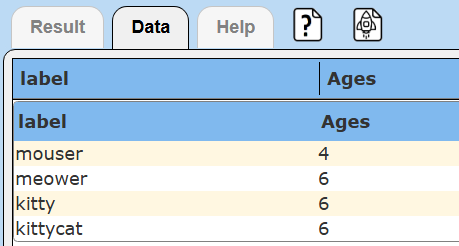
Data Tab
The data tab shows the underlying data being shown in the chart. Below is a sample example.